Overview and key trends in the Russian transportation industry
Main trends and changes in the global and Russian economies
In 2014, the global economy improved slightly as a whole. According to the International Monetary Fund (IMF), global GDP expanded by 3.3% last year, the same increase seen in 2013, marking the first time since 2011 that global GDP growth has not contracted versus the previous year. Meanwhile, growth in the global trade of goods and services slowed to 3.1% compared with 3.4% in 2013.
Overall global GDP growth rates in developed nations and emerging markets in 2010–2014 (IMF data), % vs. previous year
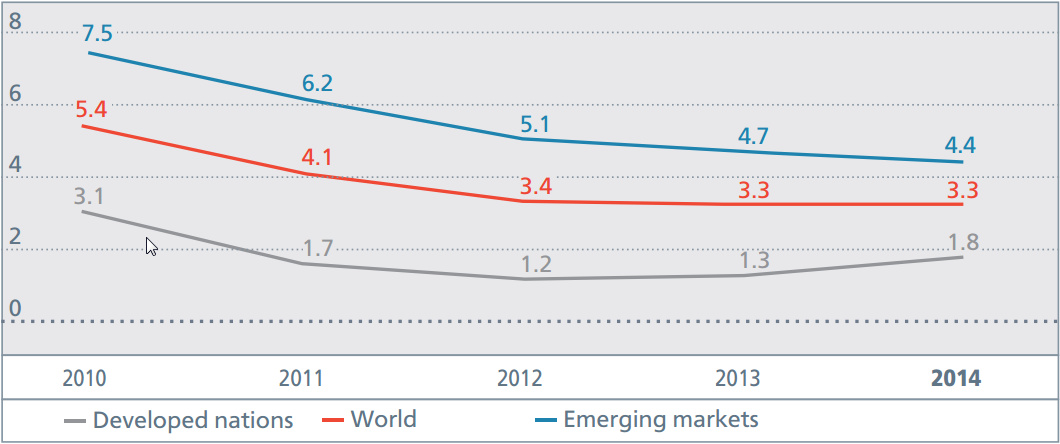
At the same time, global economic development was inconsistent in 2014. Mixed trends were seen in the world’s main economic centres. Developed nations had the greatest positive effect on global economic growth: the economic situation in the U.S. was stable and GDP expanded in the eurozone for the first time following the economic slump in
An exacerbation in the geopolitical situation around the world as well as internal economic problems in certain countries had a constraining effect on the global economy in 2014.
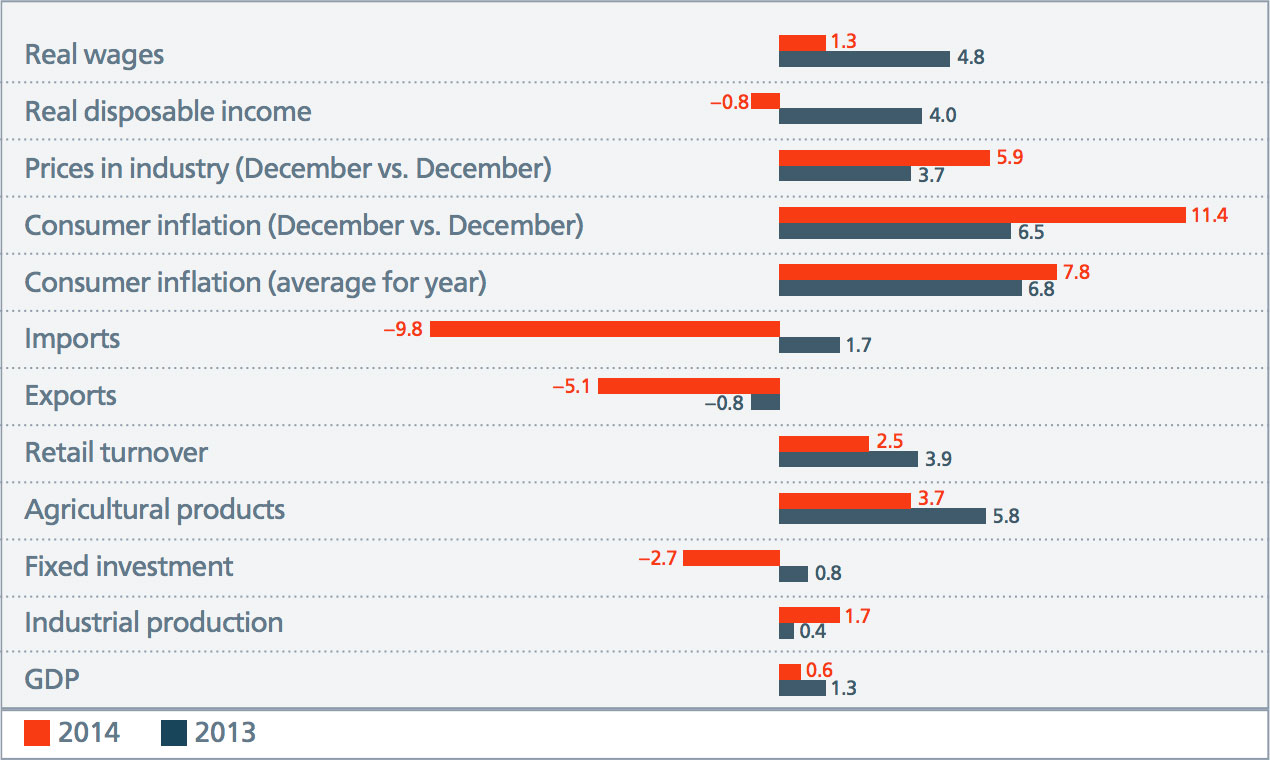
In Russia, the economic situation deteriorated significantly in 2014. GDP growth slowed from 1.3% in 2013 to 0.6% in 2014. Negative trends were seen in some of the most important macroeconomic indicators that describe the intensity of domestic demand: fixed investment decreased 2.7% over the year, while retail growth rates increased 2.5% versus 3.9% in 2013. External demand also decreased: exports declined 5.1%.
A number of negative factors influenced the economic situation in 2014. In particular, inflation increased significantly — to 11.4% (December vs. December) from 6.5% in 2013, which is attributable to the effects of sanctions against Russia, countersanctions and the rouble’s weakened exchange rate.
In addition, there was greater instability on financial markets in 2014, bank performance results declined, the Central Bank tightened its credit and monetary policy, capital outflow intensified, the country’s international reserves decreased, Russia’s financial and economic relations with the external world deteriorated significantly and prices for Russian exports declined.
Growth in Russian macroeconomic indicators in 2013–2014 as % of previous year
Overview of the Russian transportation industry
5 077 bln tkm Decrease of 0.1% compared with 2013
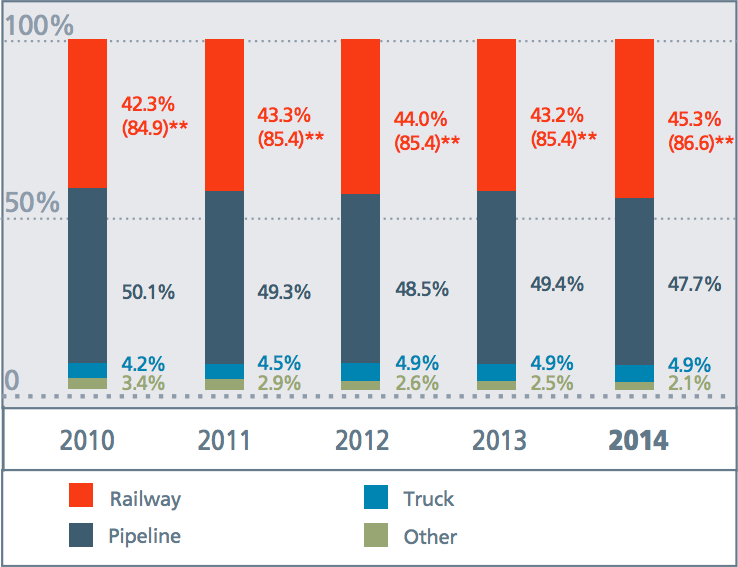
According to the Russian Federal State Statistics Service, freight turnover in Russia edged down 0.1% in 2014 to 5,077 bln tkm. Positive trends were seen only in railway and air transportation (up 4.7% and 2.8%, respectively).
As a result of these changes, the proportion of railway transportation in the freight turnover of the Russian transportation system increased to 45.3% in 2014 (an increase of 2.1 percentage points compared with 2013). If pipeline transportation is excluded, this indicator was equal to 86.6%.
Loaded freight turnover via railway transportation totalled 2,298.6 bln tkm in 2014 (excluding empty runs by Russian Railways railcars).
| 2013 | 2014 | Share in overall freight turnover, % | |||
|---|---|---|---|---|---|
| bln tkm | bln tkm | as % vs. 2013 | 2013 | 2014 | |
| Freight turnover by transportation | 5 084,3 | 5 077,0 | –0,1 | 100,0 | 100,0 |
| railwayLoaded freight turnover via railway transportation. | 2 196,2 | 2 298,6 | 4,7 | 43,2 | 45,3 |
| truck | 250,2 | 246,7 | –1,4 | 4,9 | 4,9 |
| sea | 39,5 | 31,5 | –20,2 | 0,8 | 0,6 |
| internal waters | 80,1 | 72,2 | –9,9 | 1,6 | 1,4 |
| air (transport aviation) | 5,1 | 5,2 | 2,8 | 0,1 | 0,1 |
| pipeline | 2 513,3 | 2 422,8 | –3,6 | 49,4 | 47,7 |
| Reference: share of railway transportation excluding pipelines | 85,4 | 86,6 | |||
Freight turnover by transportation mode, %
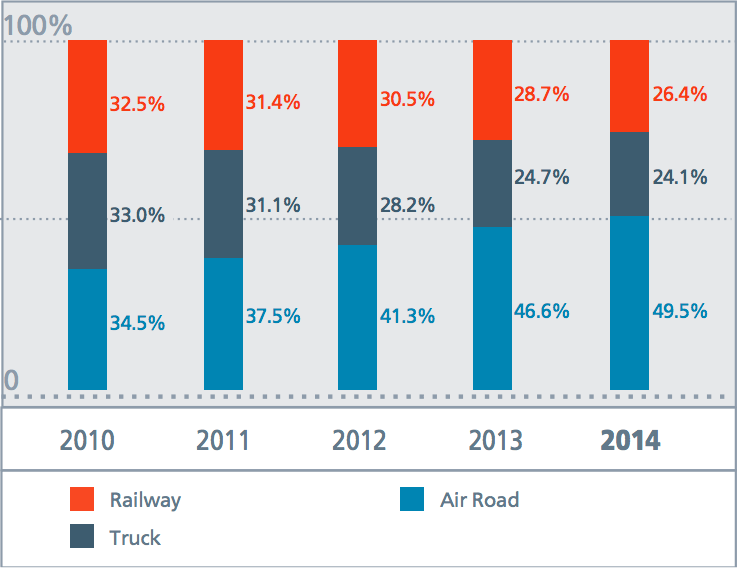
According to the Russian Federal State Statistics Service, passenger turnover on public transportation grew 0.9% to 487.6 bln passenger km in 2014 compared with 2013. This growth is fully attributable to a 7.2% increase in passenger turnover via air transportation in 2014.
The projected growth in passenger turnover via domestic air transportation resulted from a set of government-supported measures to support air travel: from funding the development of aviation infrastructure and the aircraft fleet for regional and local flights to the direct subsidising of regional and long-haul air travel routes.
Passenger turnover via railway transportation declined 7.0% to 128.8 bln passenger km in 2014, while road transportation decreased 1.6% to 117.4 bln passenger km.
The share of air travel in the overall structure of passenger turnover continues to grow. In 2014, this proportion increased by 2.9 p.p. to 49.5%, while the share of railway and road transportation fell by 2.3 p.p. and 0.6 p.p., respectively.
| 2013 | 2014 | Share in overall passenger turnover, % | |||
|---|---|---|---|---|---|
| bln |
as % vs. 2013 Minor discrepancies in the percentage calculations can be attributed to the rounding of initial data. | 2013 | 2014 | ||
| Passenger turnover via public transportation | 483,0 | 487,6 | 0,9 | 100,0 | 100,0 |
| railway According to Russian Railways data. | 138,5 | 128,8 | –7,0 | 28,7 | 26,4 |
| truck (bus) | 119,3 | 117,4 | –1,6 | 24,7 | 24,1 |
| air (transport aviation) According to Federal Air Transportation Agency data. | 225,2 | 241,4 | 7,2 | 46,6 | 49,5 |
Passenger turnover by type of public transportation % Excluding municipal and water-based types of transportation.