Freight shipments
| Indicator | Measurement unit | 2010 | 2011 | 2012 | 2013 | 2014 | Change as % |
|---|---|---|---|---|---|---|---|
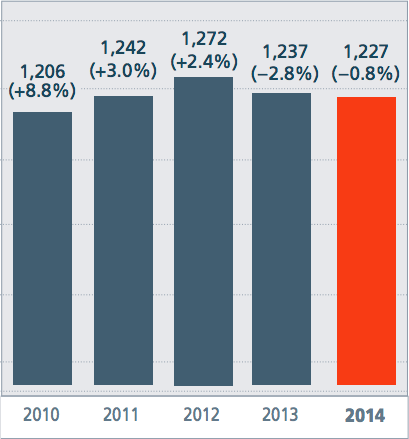
| Handling | mln t | 1,205.8 | 1,241.5 | 1,271.9 | 1,236.8 | 1,226.9 | –0.8 |
| average per day | ‘000 t | 3,303.5 | 3,401.5 | 3,475.0 | 3,388.5 | 3,361.5 | –0.8 |
| Overall freight turnover, including | bln tkm | 2,501.8 | 2,704.8 | 2,782.6 | 2,813.1 | 2,954.5 | 5.0 |
| loaded freight turnover | bln tkm | 2,011.3 | 2,127.8 | 2,222.4 | 2,196.2 | 2,298.6 | 4.7 |
| empty freight turnover | bln tkm | 490.5 | 576.9 | 560.2 | 616.9 | 655.9 | 6.3 |
| Proportion of shipments delivered by the required (contractual) date | % | 87.2 | 81.6 | 72.5 | 77.5 | 87.1 | 9.6 p.p. |
Handling
Given the challenging macroeconomic environment and decrease in the railway transportation freight base, the volume of freight handling on the railway network edged down 0.8% in 2014 compared with 2013. The main reason for this decrease was a reduction in the handling of construction materials and metal ores.
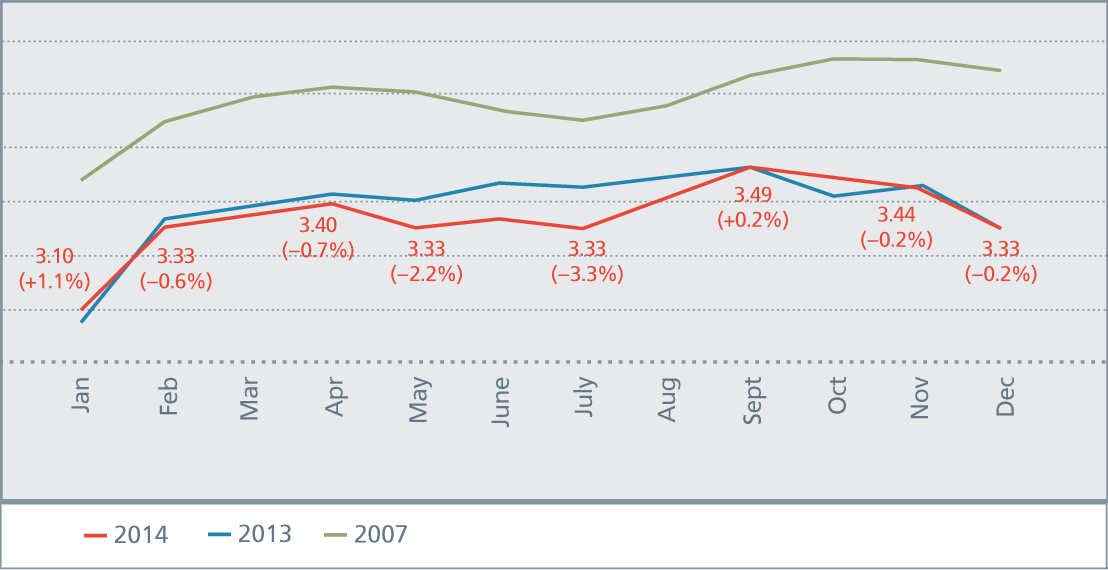
Average daily handling on Russian Railways infrastructure in 2014 3,361.5 thousand t A decrease of 0.8% compared with 2013
The noticeable reduction in handling volumes in the middle of the year, particularly from May to July, was largely compensated in the fourth quarter. The key role in this improvement came from measures to attract additional freight for transportation and improve the quality of services provided (in particular, additional services as part of general transportation services as well as integrated transportation and logistics services).
As a result, significant growth was achieved in average daily freight handling in the fourth quarter compared with the second and third quarters.
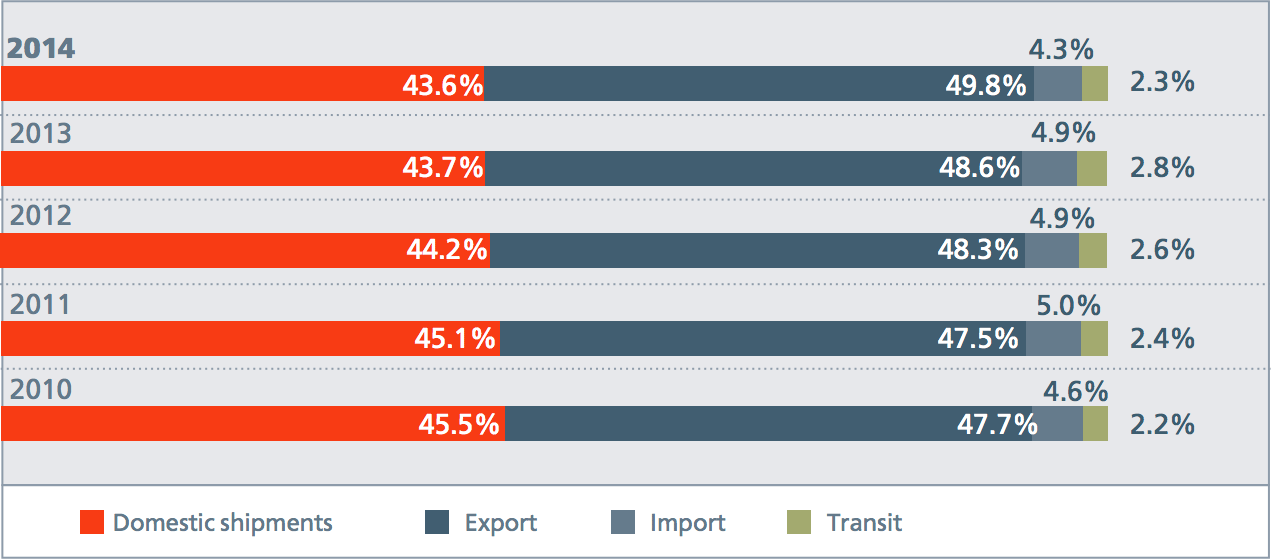
Freight handling totalled 1,226.9 mln tonnes in 2014 (3,361,500 tonnes on average per day). At the same time, freight handling for exports increased 4.3% compared to the previous year and totalled 420 mln tonnes, while the handling of domestic traffic declined 3.2% to 797.5 mln tonnes.
As a consequence, the share of domestic traffic in the overall handling structure fell from 66.6% in 2013 to 65.0% in 2014, while the proportion of exports increased from 32.5% to 34.2%.
Average daily handling, mln t
Handling volume, mln t
| Indicator | 2013 | Share in 2013 | 2014 | ||
|---|---|---|---|---|---|
| Value | Share in 2014 | Change as % | |||
| Handling | 1,236.8 | 100.0 | 1,226.9 | 100.0 | –0.8 |
| Domestic traffic | 823.9 | 66.6 | 797.5 | 65.0 | –3.2 |
| Export, including | 402.4 | 32.5 | 420.0 | 34.2 | 4.3 |
| via ports | 225.0 | 18.2 | 250.3 | 20.4 | 11.3 |
| via border crossings | 177.5 | 14.3 | 169.6 | 13.8 | –4.5 |
| Import and transit | 10.4 | 0.9 | 9.5 | 0.8 | –8.9 |
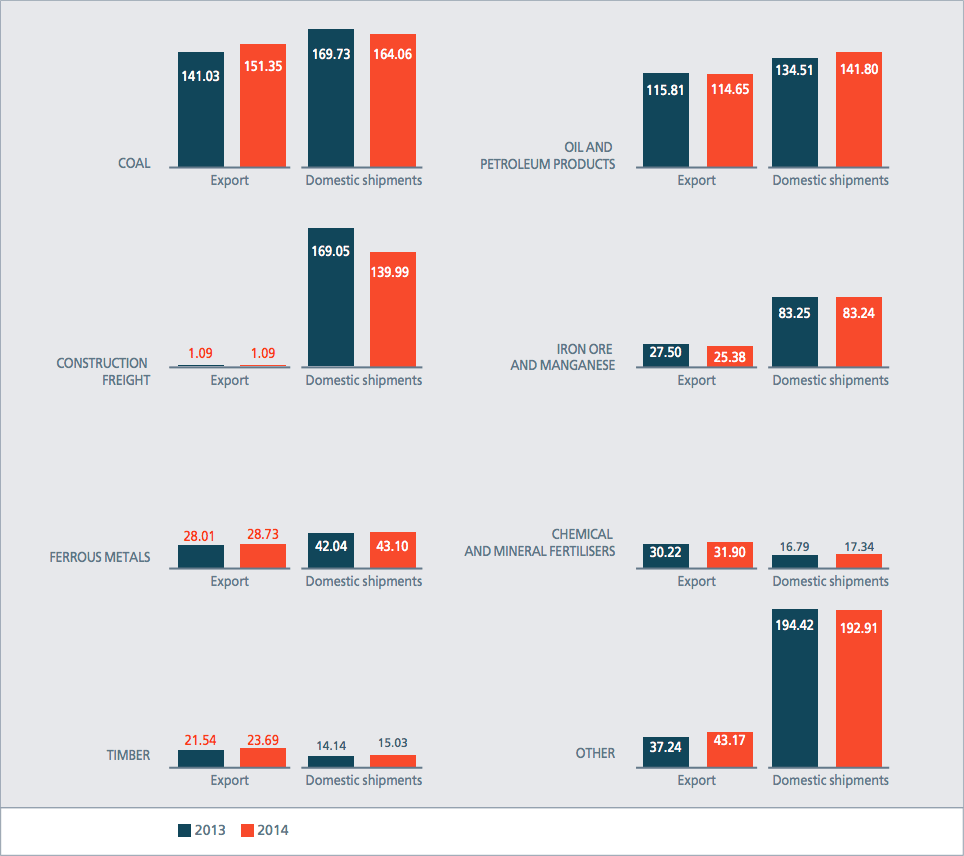
The overall handling structure is dominated by coal, oil, petroleum products, construction freight and ore. In 2014, these products made up 68% of total handling volume.
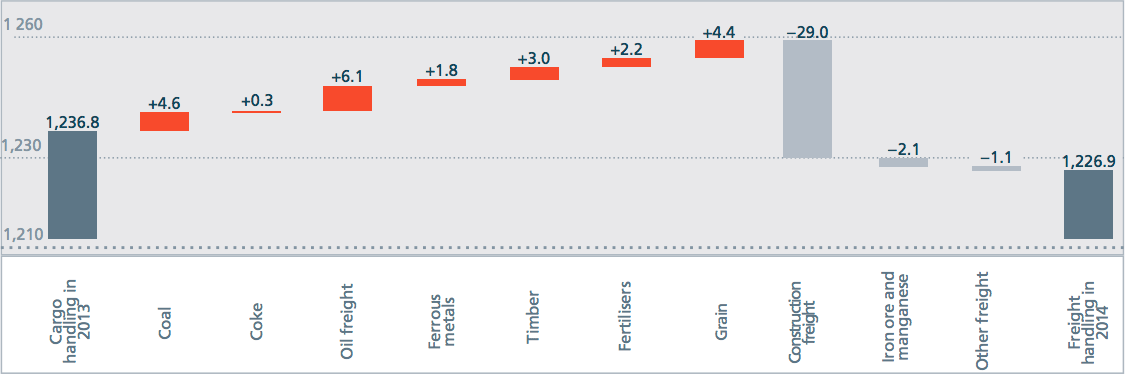
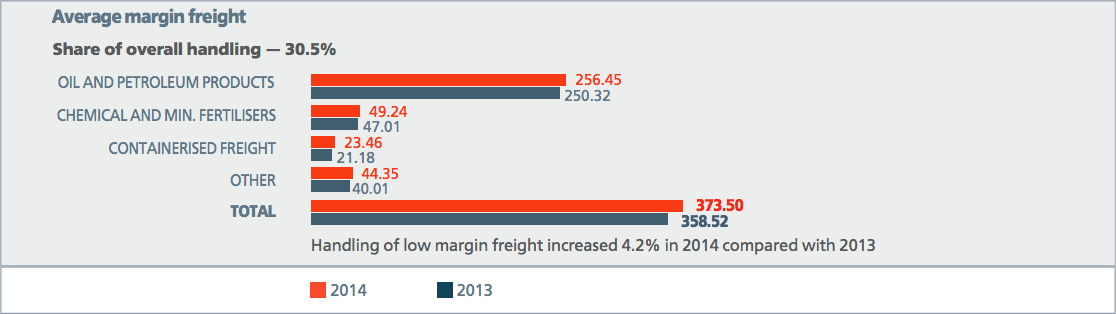
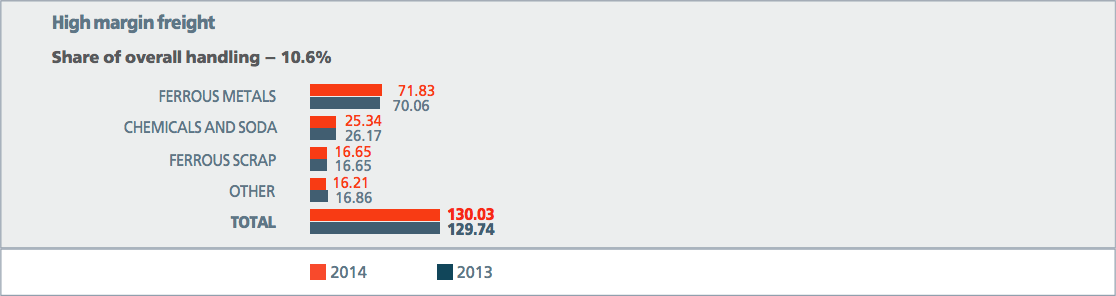
In 2014, growth was seen in handling compared with 2013 for the main freight flows of the third tariff class (high margin): ferrous metals (+2.5%, +1.8 mln tonnes); second class tariff (average margin): grain (+32.3%, +4.4 mln tonnes) (a record harvest in 2014 led to the significant growth in handling), chemical and mineral fertilisers (+4.7%, +2.2 mln tonnes), oil and petroleum products (+2.4%, +6.1 mln tonnes); and first tariff class (low margin): timber (+8.5%, +3.0 mln tonnes), coke (+3.0%, +0.3 mln tonnes) and coal (+1.5%, +4.6 mln tonnes). At the same time, a decline was seen compared with 2013 in the handling of construction freight (–17.1%, –29 mln tonnes) and iron ore and manganese (–2.0%, –2.1 mln tonnes).
The proportion of average and high margin freight increased to 30.5% and 10.6%, respectively, in 2014.
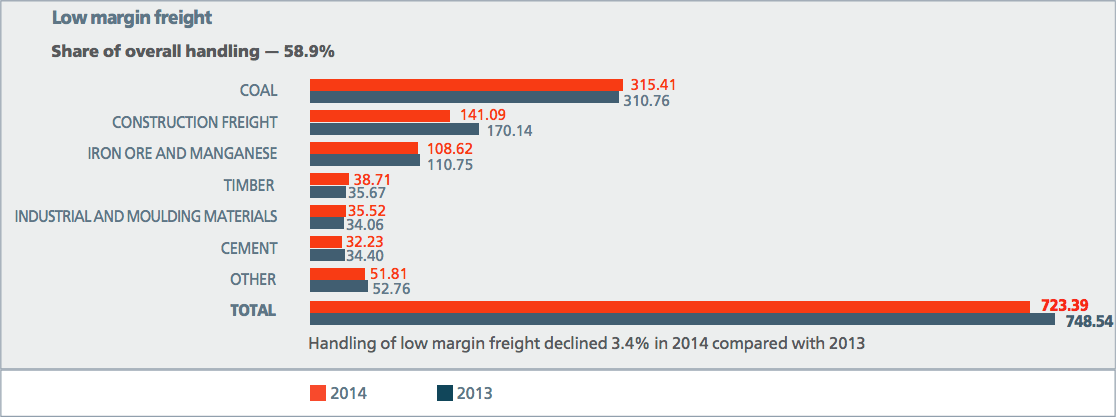
Low margin freight makes up the greatest share of freight handling at 58.9%. However, it should be noted that this figure declined by 1.5 percentage points compared with 2013 as a result a decrease in freight handling in this segment in 2014.
Handling of export and domestic freight traffic in 2014, mln t
Change in freight handling volume in 2014, mln t
Structure of freight handling in 2014, mln t
Freight turnover
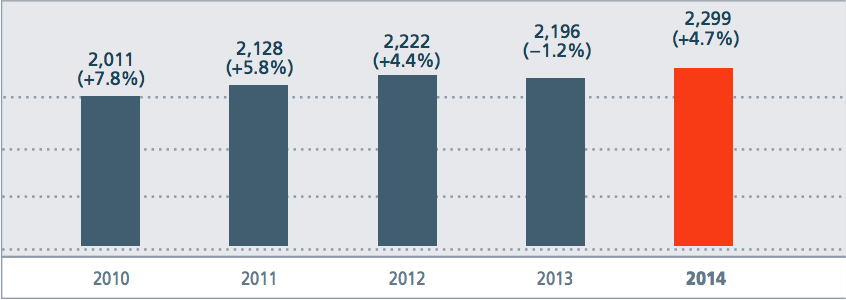
Despite the decline in handling volume, loaded freight turnover totalled 2,298.6 bln tkm, up 4.7% from the 2013 level. This is due to changes in the structure of freight transportation by area, which led to a significant 6% increase in their average range in 2014 compared with 2013.
Empty freight turnover totalled 655.9 bln tkm in 2014, a 6.3% increase compared with 2013.
Overall freight turnover grew 5% in 2014 compared with 2013 and totalled 2,954.5 bln tkm.
| Indicator | Freight turnover, bln tkm | Change in freight turnover share | % of change freight turnover 2014 vs. 2013 | |||
|---|---|---|---|---|---|---|
| 2013 | Share | 2014 | Share | |||
| Coal | 813.6 | 37.1 | 884.7 | 38.5 | 1.4 | 108.7 |
| Oil and petroleum products | 429.6 | 19.6 | 443.0 | 19.3 | –0.3 | 103.1 |
| Mineral construction materials | 220.6 | 10.1 | 220.4 | 9.6 | –0.5 | 99.9 |
| All ore | 154.5 | 7.0 | 149.2 | 6.5 | –0.5 | 96.6 |
| Ferrous metals | 126.9 | 5.8 | 132.4 | 5.8 | 0.0 | 104.4 |
| Chemical and mineral fertilisers | 78.5 | 3.6 | 82.9 | 3.6 | 0.0 | 105.5 |
| Timber | 59.5 | 2.7 | 64.5 | 2.8 | 0.1 | 108.5 |
| Coke | 28.9 | 1.3 | 28.6 | 1.2 | –0.1 | 98.9 |
| Baked goods | 30.3 | 1.4 | 34.4 | 1.5 | 0.1 | 113.7 |
| Other freight | 249.6 | 11.4 | 255.1 | 11.1 | –0.3 | 102.2 |
| Total | 2,191.9 | 100.0 | 2,295.2 | 100.0 | 0.0 | 104.7 |
| Cargo luggage | 4.3 | 3.4 | 78.3 | |||
| Total loaded freight turnover | 2,196.2 | 2,298.6 | 104.7 | |||
| Empty freight turnover | 616.9 | 655.9 | 106.3 | |||
| TOTAL | 2,813.1 | 2,954.5 | 105.0 | |||
| Indicator | 2013 | 2014 | % |
|---|---|---|---|
| Loaded shipment | 1,573 | 1,668 | 106.0 |
| Empty shipment | 1,121 | 1,170 | 104.4 |
| AVERAGE TOTAL FOR NETWORK | 1,445 | 1,524 | 105.5 |